Visitors page redesigned
· Artur Jürgenson
The Visitors page now opens with how many people your agents are reaching and how that is changing, and the list below says more about each visit.
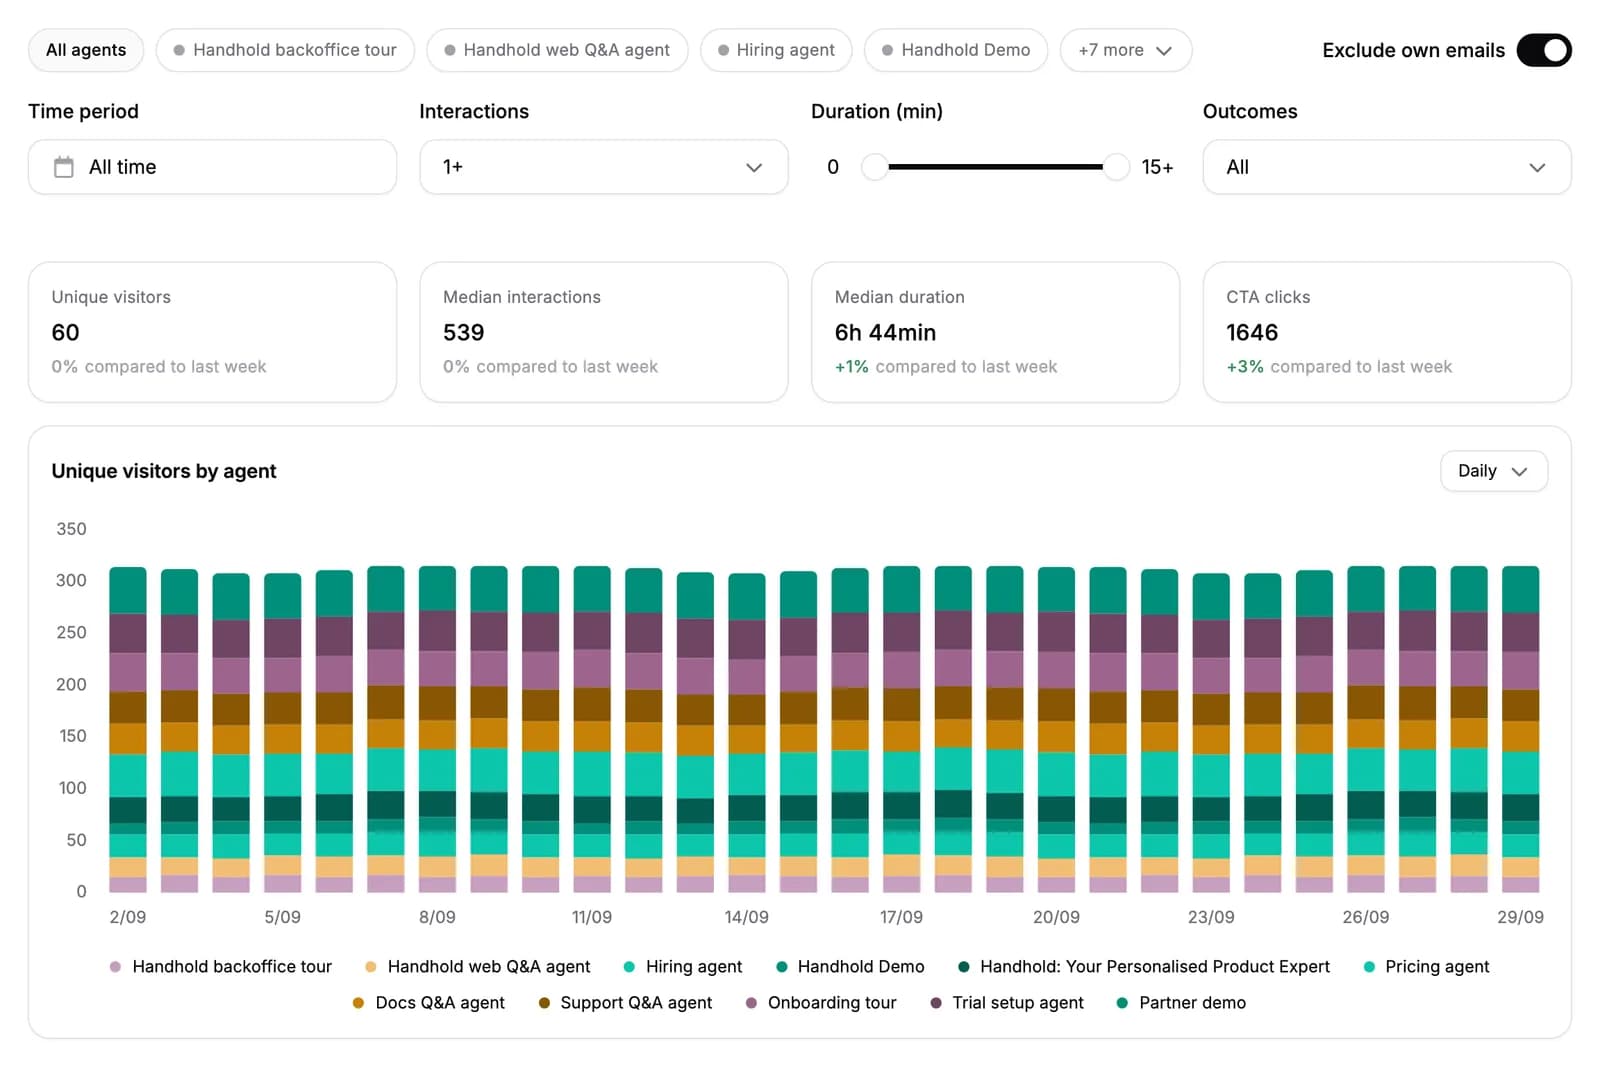
Four numbers with their trend. Unique visitors, median interactions per visitor, median duration per visitor and CTA clicks. Each one is compared with the week before, or with the preceding period of the same length when you pick a date range.
Unique visitors by agent. A bar per day, week or month, split by the agent each visitor spoke to. It runs from your first visit to your last, unless you pick a date range.
Filter by agent, duration and outcome. Chips scope the page to the agents you pick. The engagement filter is replaced by an outcomes filter, so you can find everyone who reached a particular call to action, and a duration filter covers how long visitors stayed. The filters apply to the numbers, the chart and the list together; the search box narrows the list alone.
More on every row. How long the visitor spent with your agents, which calls to action they reached, and which agents they used, with the number of sessions they had with each.
A time period that decides what the numbers count. Picking a date range used to choose which visitors appeared, while their numbers stayed lifetime totals. It now also decides which sessions those numbers describe. Leave it on All time for lifetime totals.
A visitor's page leads with who they are. Each visitor page is titled with their email address, and everything your agents collected about them is laid out in a grid.
For AI agents: a clean Markdown version is available at /changelog/2026-09-29-a-new-visitors-page.md.